Implementation
Implementation covers whether the policies and guidelines are materialized, as well as disclosed performance cover all areas including environment, social and anti-corruption, all operations including emerging markets, all organizational levels, supply chain, and the product life cycle. To assess implementation coverage, we looked for evidence in comprehensive reporting of sustainability performance across key performance indicators.
Transparency creates accountability, not just for the company but also for its stakeholders. Better transparency in reporting ESG outcomes can restore trust in business by showing that it is taking action on sustainability. It can also mobilize stakeholders to contribute towards progress towards sustainability goals. Addressing sustainability challenges such as climate change requires collaboration between multiple stakeholder groups in a long time-horizon and trust is essential for that collaboration to be impactful and long-lasting.
Results Disclosure
What gets measured, gets improved. Transparency on the material environmental, social and governance performance results signals that it is monitoring progress toward sustainability goals and increases confidence in the company’s ability to create sustainable value for all its stakeholders. Furthermore, sharing results creates an opportunity for benchmarking for others to follow, thereby increasing the speed of learning.
Investors are increasingly looking for incorporating environmental, social and governance factors to calculate enterprise value. However, standards and regulations are not yet in place to define how to value and report performance on material topics. Emerging global standards for sustainability reporting, including the GRI standards and IIRC are gaining broader acceptance, but the field of sustainability reporting is still open for public and private organizations to experiment with new approaches.
Global Sustainability Leaders are leading this effort:
We find that 98%, 95% and 99% of the companies in our sample have shared results on their environmental, social and governance performance indicators.
Best-in-class companies:
- are transparent and accountable with their sustainability efforts and disclosure policy;
- ensure the comprehensiveness of policy and implementation throughout the value chain including the supply chain, the product lifecycle, all geographies, all stakeholder groups and all levels of the organization;
- measure performance across key sustainable performance indicators and report past performance as well as future targets;
- share the assessment of their performance and remedial actions.
Below are several examples that report ESG results with comprehensive coverage across several dimensions:
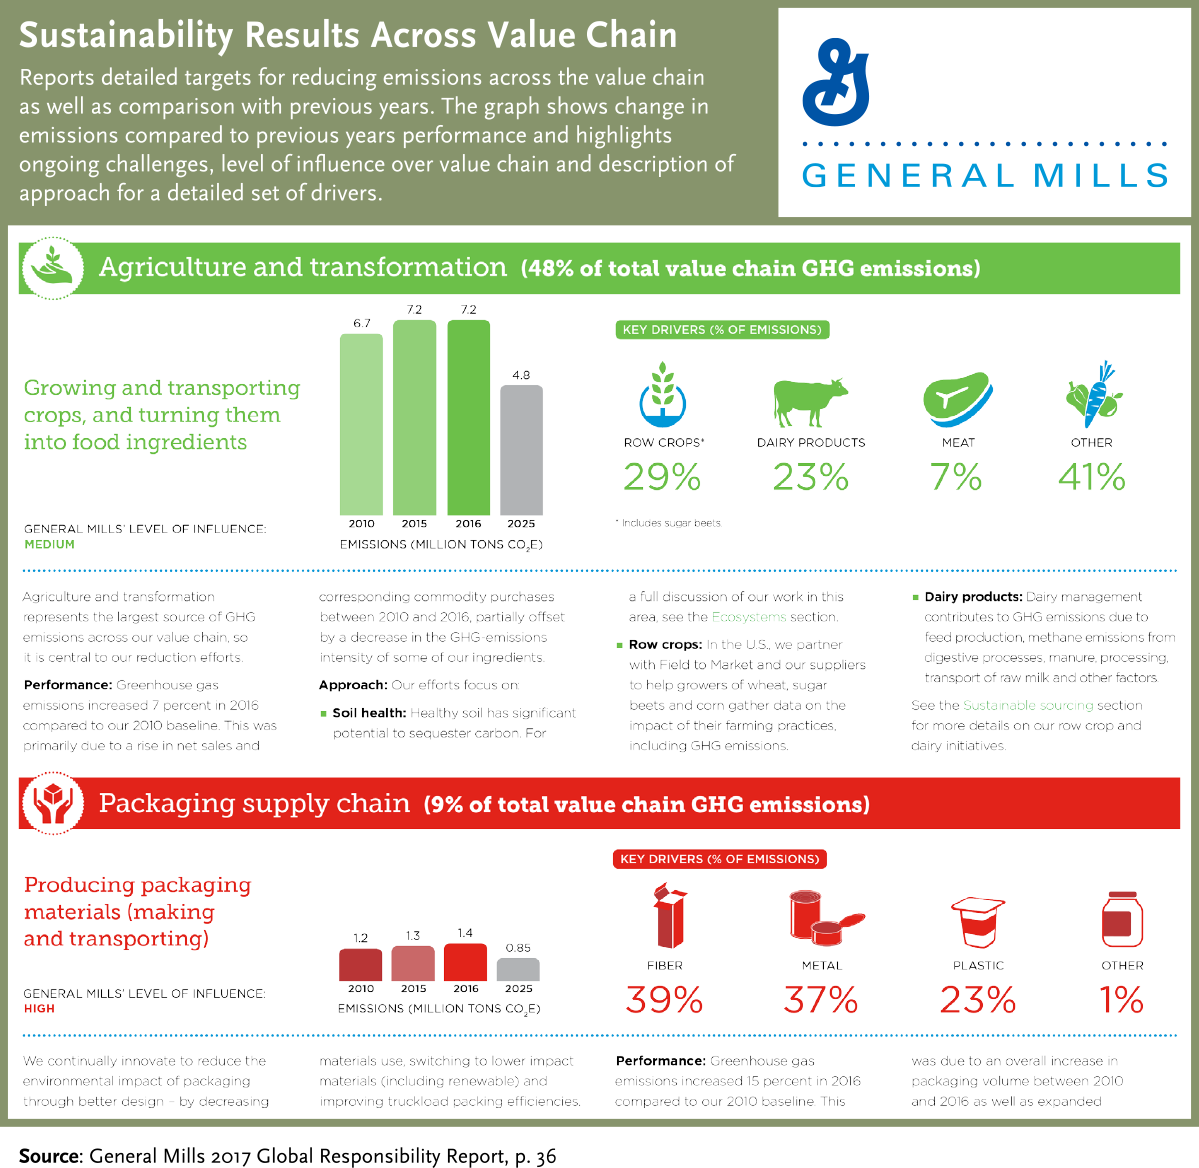
In this chart, General Mills presents results on emissions reduction efforts across its value chain. General Mills takes environmental stewardship into consideration all the way from agriculture, packaging supply chain, producing, shipping, selling and consuming. The chart shows results for the current year and targets, and puts the numbers in perspective by sharing previous years’ results. For each part of the value chain, General Mills shares the percentage of GHG emissions from that section (e.g. Agriculture and transformation account for 50% of total value chain GHG emissions, supply chain for 8%), level of influence the company has (e.g. Low, Medium, High), key drivers and relative importance for that phase, assessment of performance compared to previous years, and approach for reaching targets (e.g. External collaboration, sustainable sourcing commitments).
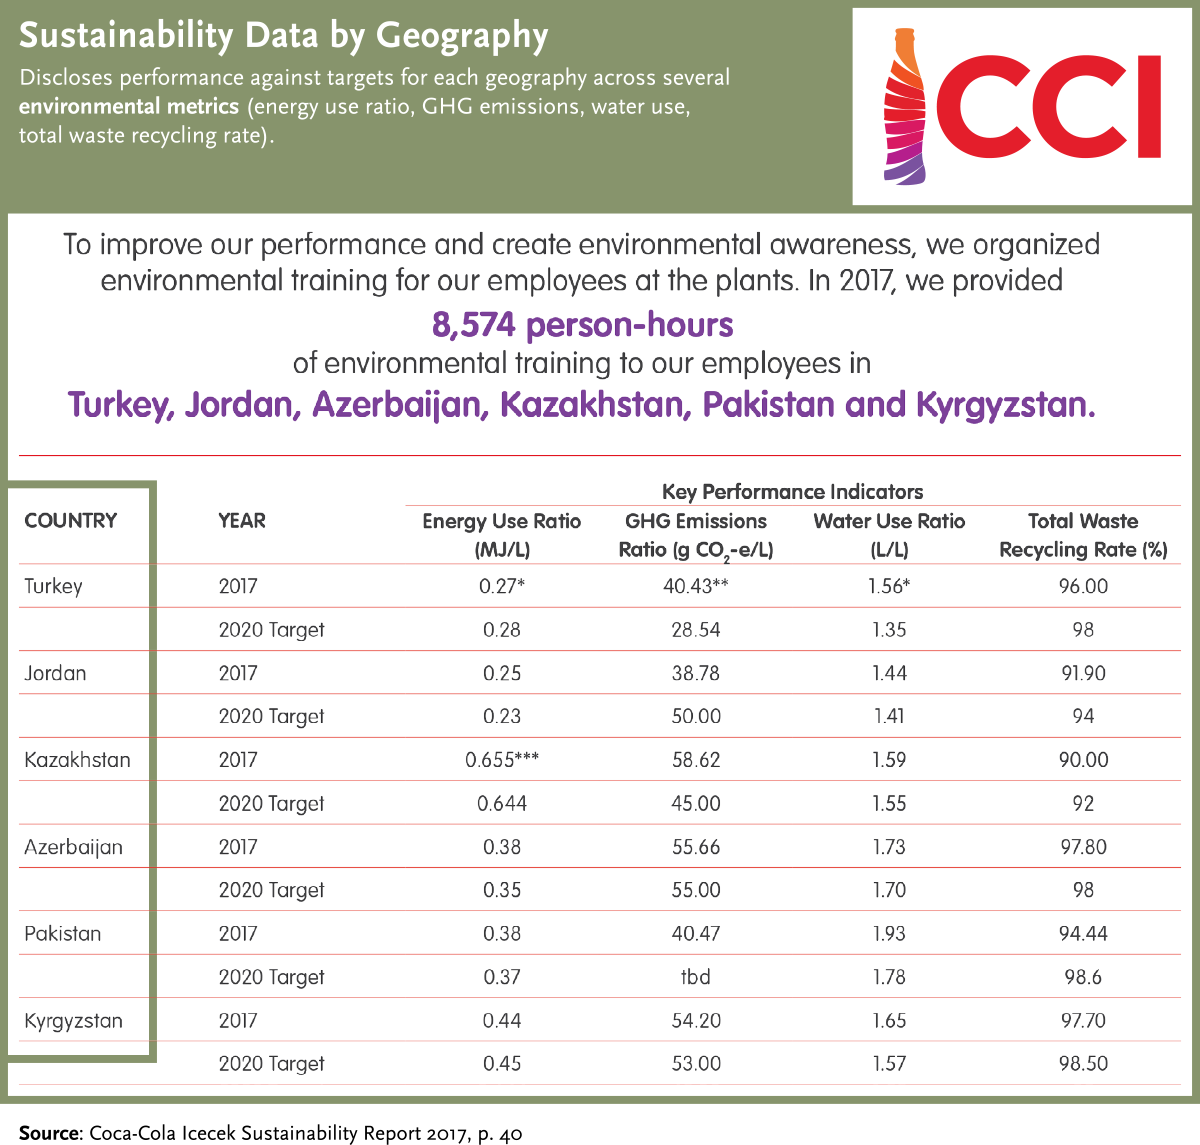
Coca Cola Icecek environmental results chart is a good example for geographical coverage. The company discloses performance against targets across several environmental metrics (energy use ratio, GHG emissions, water use, total waste recycling rate) for each geography. The chart indicates that results have been audited by an independent firm, which gives assurance to shareholders that results are accurate. Furthermore, the report discloses the geographical coverage ratio for its sustainability results and its commitment to increase this coverage.
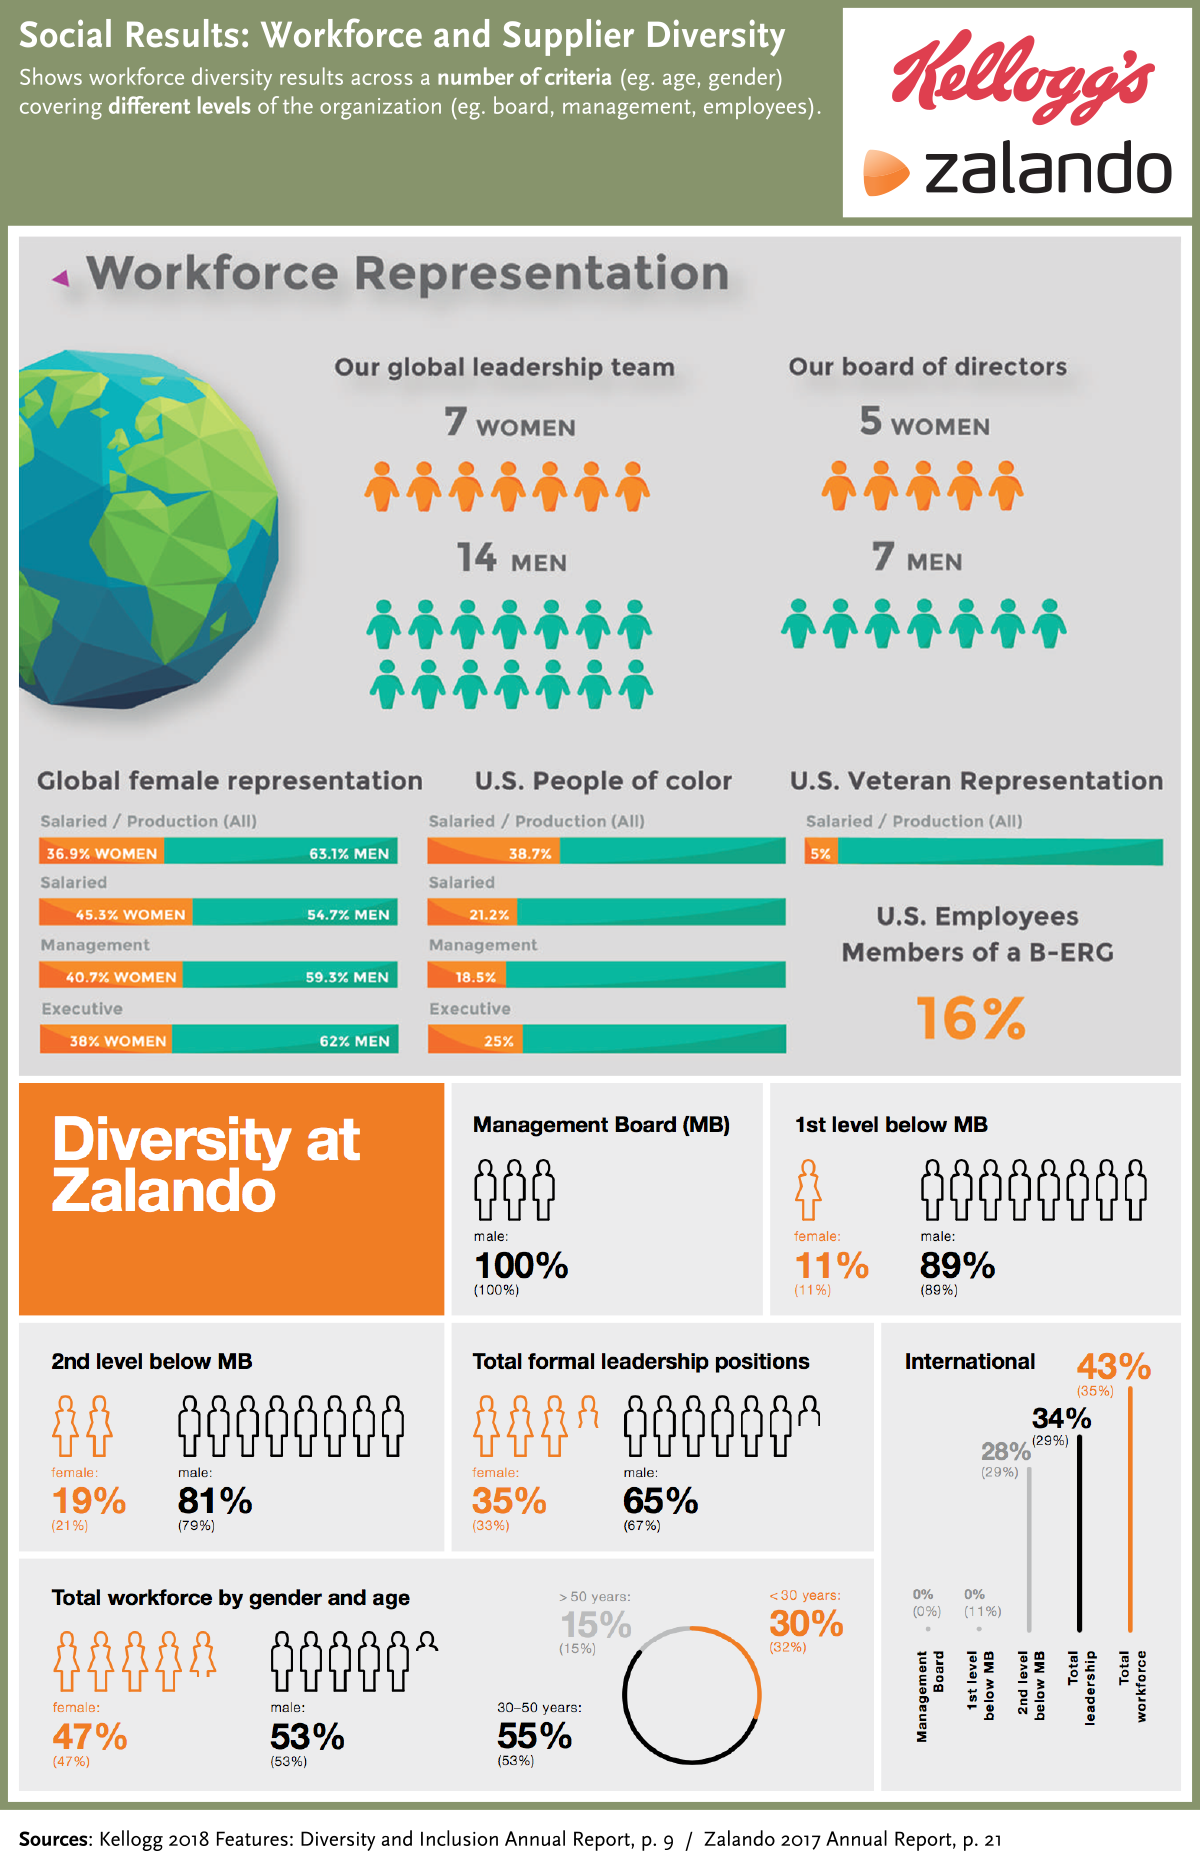
The two example charts from Kellogg and Zalando show workforce diversity results across a number of criteria. Results are presented in an infographic covering different levels of the organization including the board, management and different levels of the workforce. Diversity and inclusion criteria should include more than just gender. To ensure better diversity companies, should report results for a wider range of diversity criteria based on what matters for the company and its stakeholders: including race, age and tenure. Inclusion of disadvantaged people should also be part of diversity (e.g. hiring people with disabilities or from disadvantaged communities). Kellogg from United States uses “people of color” and Zalando from Germany uses “international” to define a similar diversity concept. In its results chart, Zalando also mentions that they have set future targets for female leadership at executive and board level and that company is on course of accomplishing the future targets.
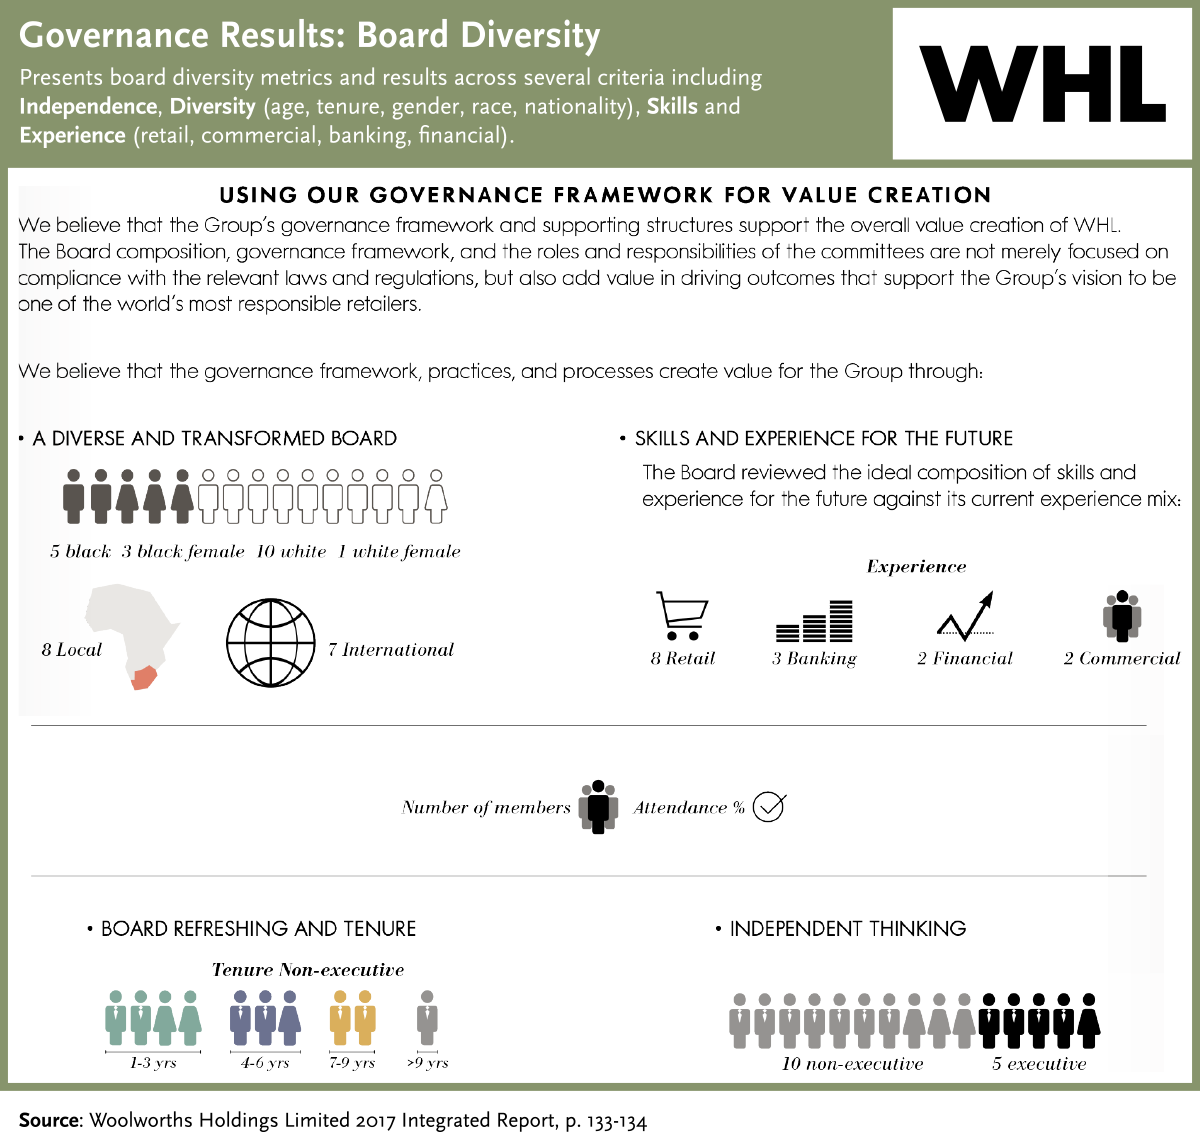
Woolworth’s Holdings chart is a good example of breadth and depth in sharing governance results. Board diversity metrics and results are presented across several criteria including: Independence, Diversity (age, tenure, gender, race, nationality), Skills and Experience (retail, commercial, banking, financial). The results for skills diversity are helpful because it can foster understanding of which key skills should be incorporated into the board of this specific company. Attendance for each board member is also provided. The chart includes diversity targets vs. progress towards targets, suggesting a continuous process for improvement across diversity performance indicators.
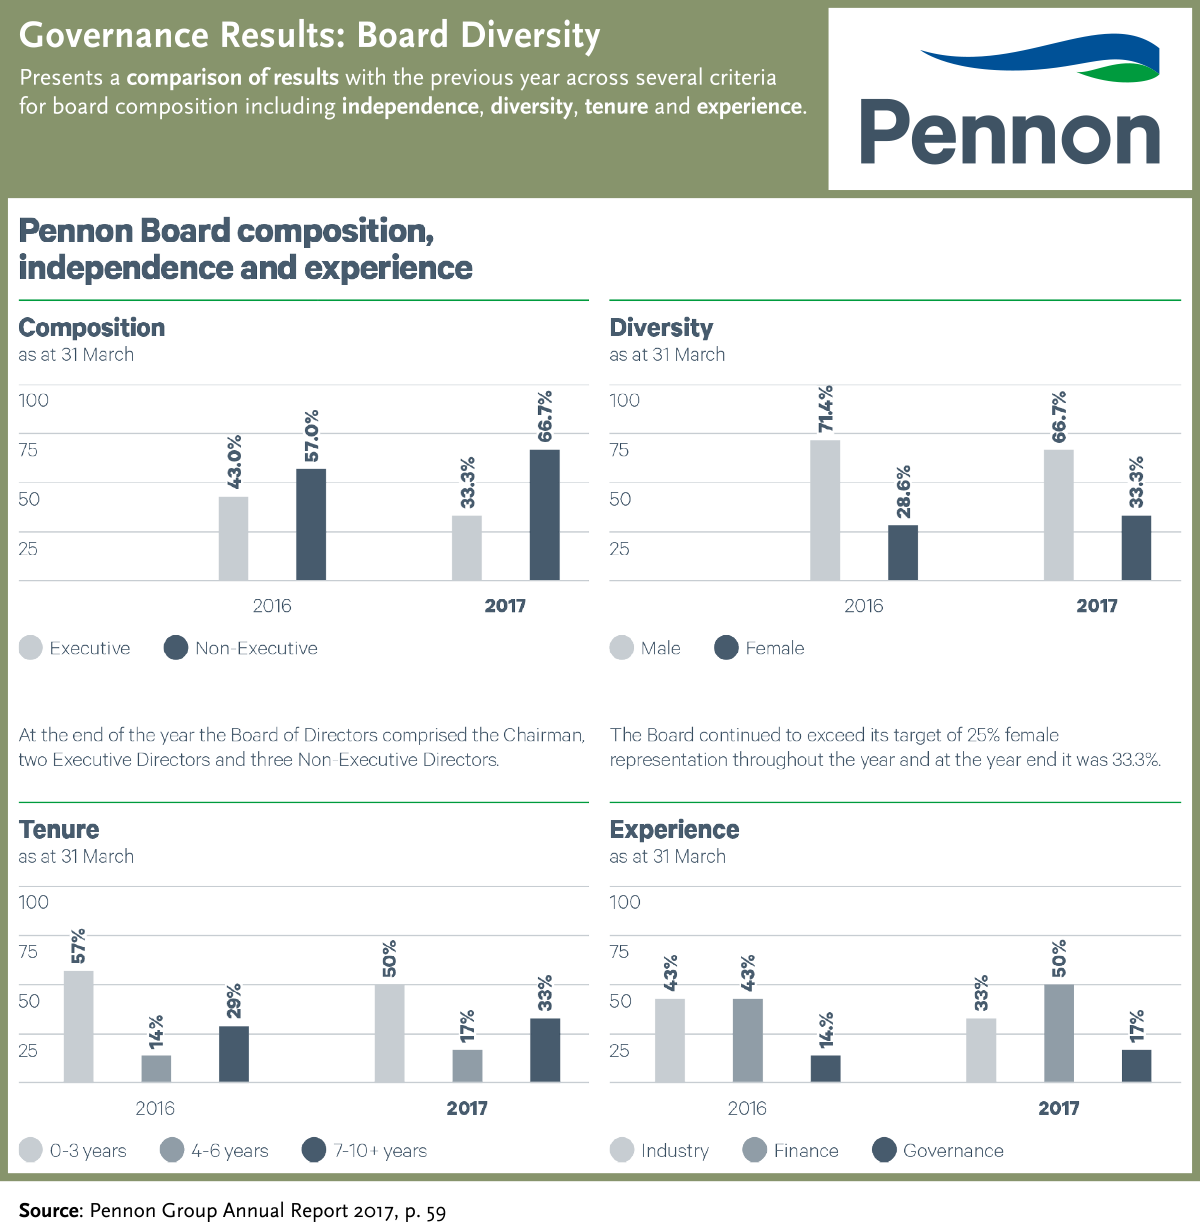
Another example that provides comparable results for board diversity is Pennon. The charts present a comparison of results with the previous year across several criteria for board composition including independence, diversity, tenure and experience.
Supply Chain Coverage
Supply chains are critical links that connect an organization's inputs to its outputs. Many companies’ greatest sustainability risks and opportunities are in the supply chain. However, sustainability efforts of many companies are limited to measuring the sustainability of their own business operations and do not extend these efforts to their suppliers and customers. Encouraging companies to measure and report more details about suppliers can lead to improved performance.
Leading companies in sustainability accept responsibility throughout their value chains and work with their suppliers to implement sustainability initiatives on a wider playing field. This may involve utilizing their purchasing power to encourage, audit, collaborate with, and provide benchmarking and learning opportunities with its suppliers on key sustainability issues.
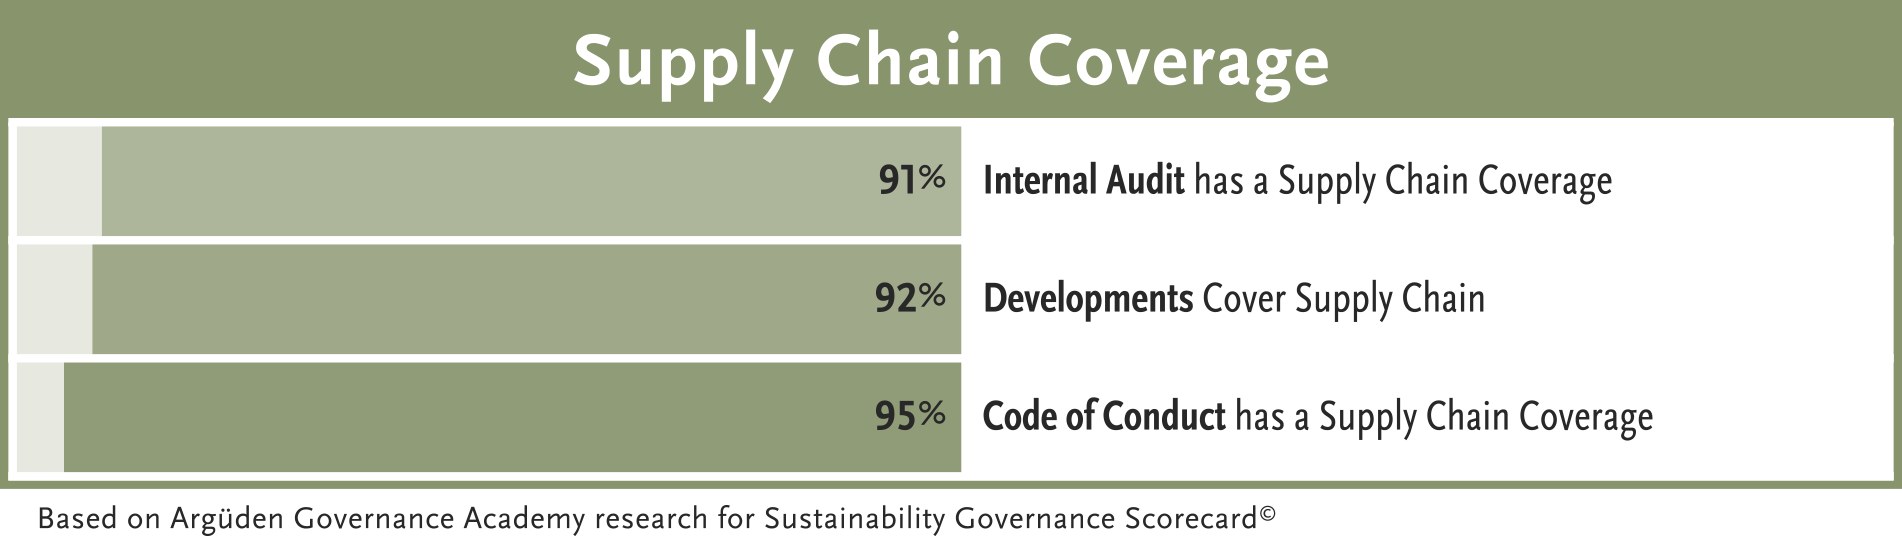
Global Sustainability Leaders recognize the importance of supply chain for achieving their sustainability targets and are transparent about their efforts.
Our assessment shows that 95% of GSL share a Supplier Code of Conduct and that supply chain coverage for developments and internal audit is 92% and 91% respectively.
However, there is still potential for improvement in ensuring implementation effectiveness and reducing risk across supply chain through more effective due diligence and incentive mechanisms.
Supply chains can pose significant risks for a company’s reputation and sustainability goals cannot be achieved success if suppliers are not on board. To ensure that suppliers are working in line with company policies; audit process should be clearly disclosed in Supplier Code of Conduct. Due diligence procedure should include proper internal audits as well as independent audit. Remedial action should be conducted for suppliers that are not up to standards.
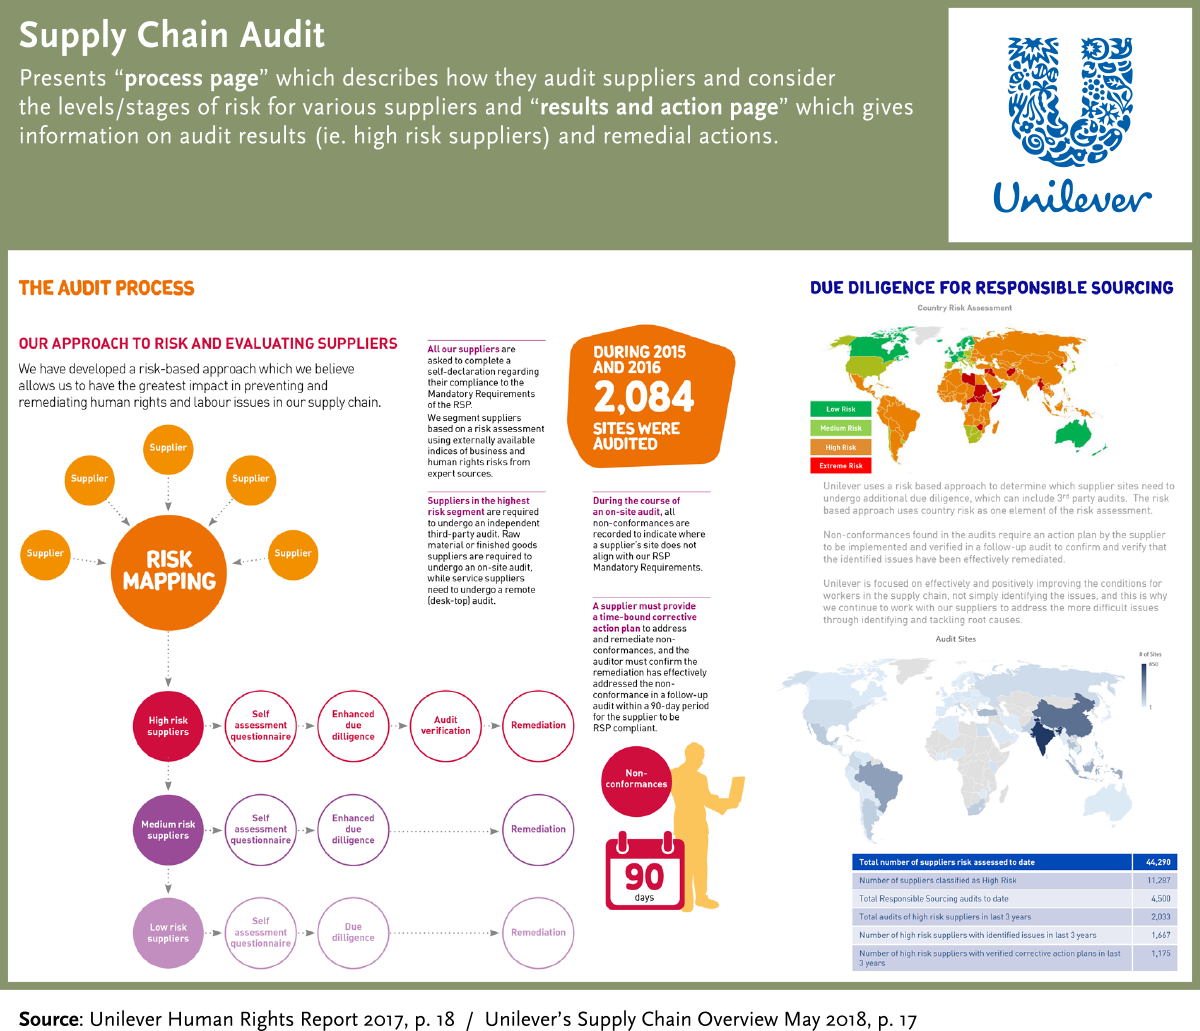
Unilever also has two good practice examples for supply chain a) “process page” which describes how they audit suppliers and consider the levels/stages of risk for various suppliers. b) “results and action page” where it is possible to quantify the numbers of total supplier audits conducted, how many were categorized as high-risk suppliers and which remedial actions have been taken accordingly. The process page gives the details on risk analysis. The results page includes a heat map, which is easy to understand and allows an overall perspective of covering the whole geography of operations.
Apart from such engagement with the suppliers within the value chain, approaches such as supplier management, product design, manufacturing rationalization, and distribution optimization can be utilized to minimize negative externalities throughout the company's value chain. Furthermore, the sustainability impacts of the company's activities further downstream, including its final customers, can also be mitigated by product design and customer education.
Adidas and Diageo are two examples that incorporate supply chain in their sustainability targets and development efforts.
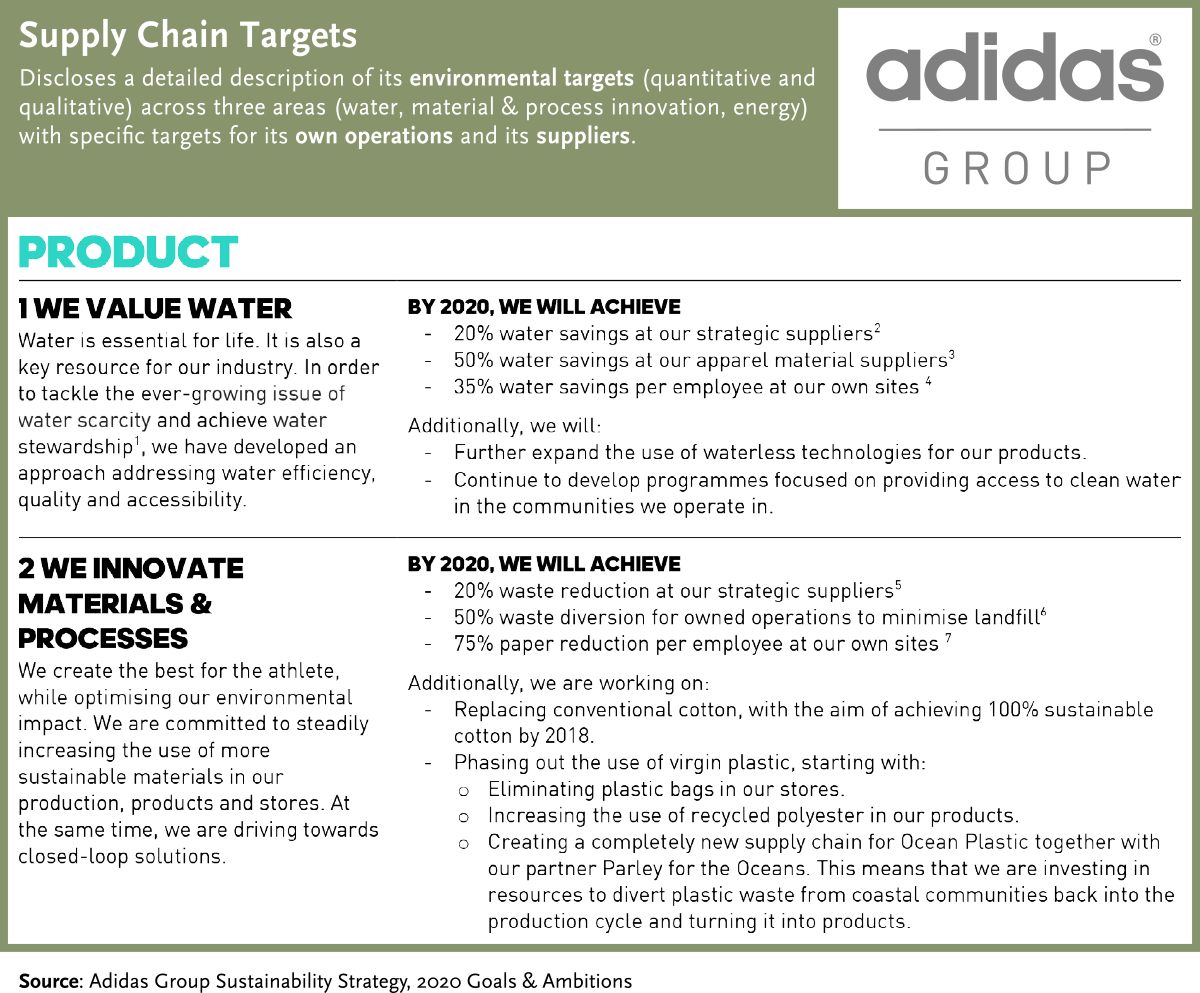
Adidas discloses a detailed description of its environmental targets across three areas (water, material & process innovation, energy) with specific targets for its own operations and its suppliers. The targets are a combination of quantitative and qualitative measures that focus on managing negative impact as well as fostering innovation in its own operations as well as its supply chain. Quantitative targets are differentiated for different supplier groups and employees (e.g. 20% water savings in strategic suppliers, 50% water savings in material suppliers, 35% water savings per employee in own sites).
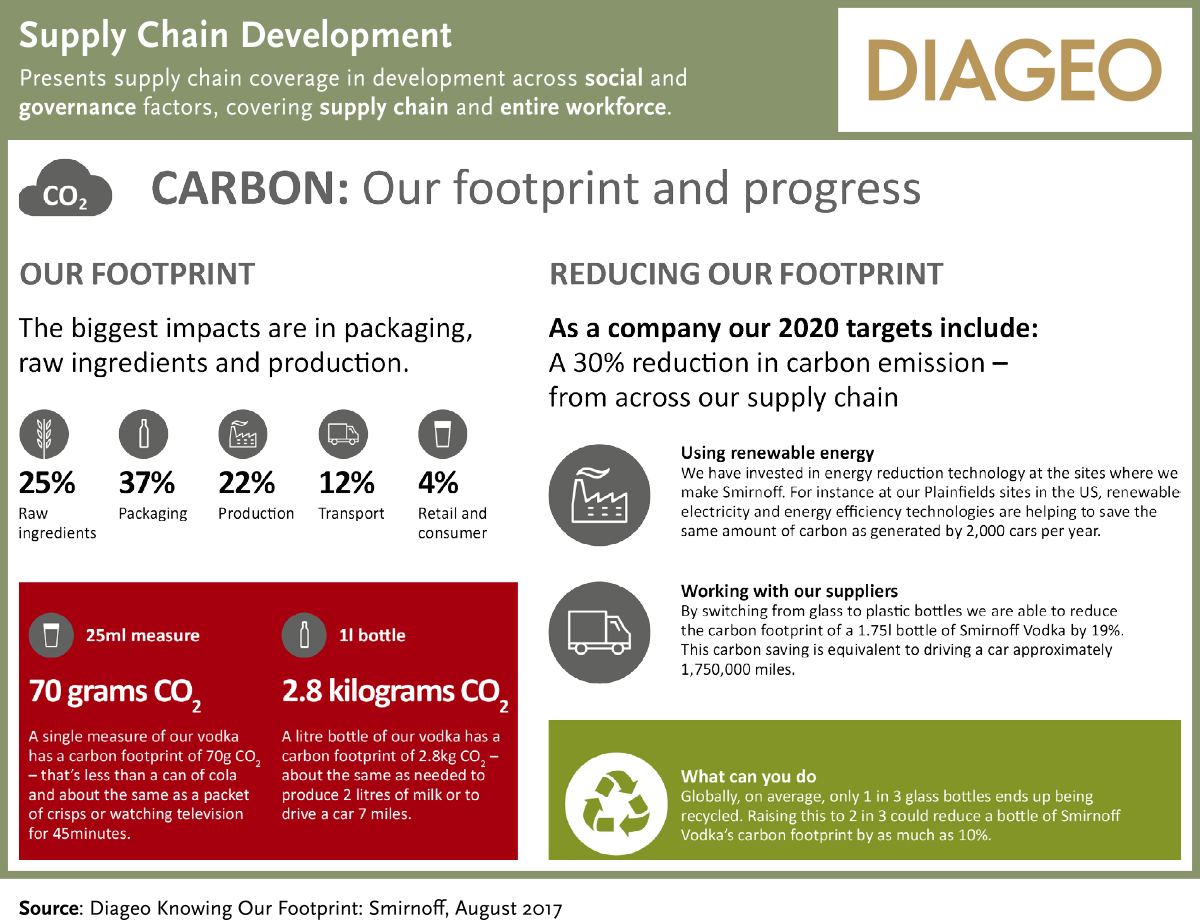
Diageo is good example of supply chain coverage in development across social and governance factors. Disclosed commitments include empowering its supply chain through expanding and refining the grievance systems and skill training programs; and achieving sustainable leadership at suppliers and licensees through governance and leadership level certification.
In short, managing sustainability requires a company to assume responsibility to manage the impact of all its activities, including its supply chain and the full product portfolio throughout the lifecycle of its products. Hence boards need to focus not only on the sustainability issues arising from the company’s own operations but also on minimizing the impacts throughout its value chain and throughout the lifecycle of its full product portfolio.
Gizem Argüden, Kübra Koldemir, Çağhan Karanberk